What lies behind Bermuda Triangle stories?
An exciting tale does not prove mysterious forces. Ask for comparable numbers and checkable circumstances.
The short answer
Many accident reports sound worrying. But places with many ships can have more reports too. We therefore compare accidents and numbers of journeys with other areas. We also check weather and reliable records.
An exciting story alone does not prove a mysterious force.
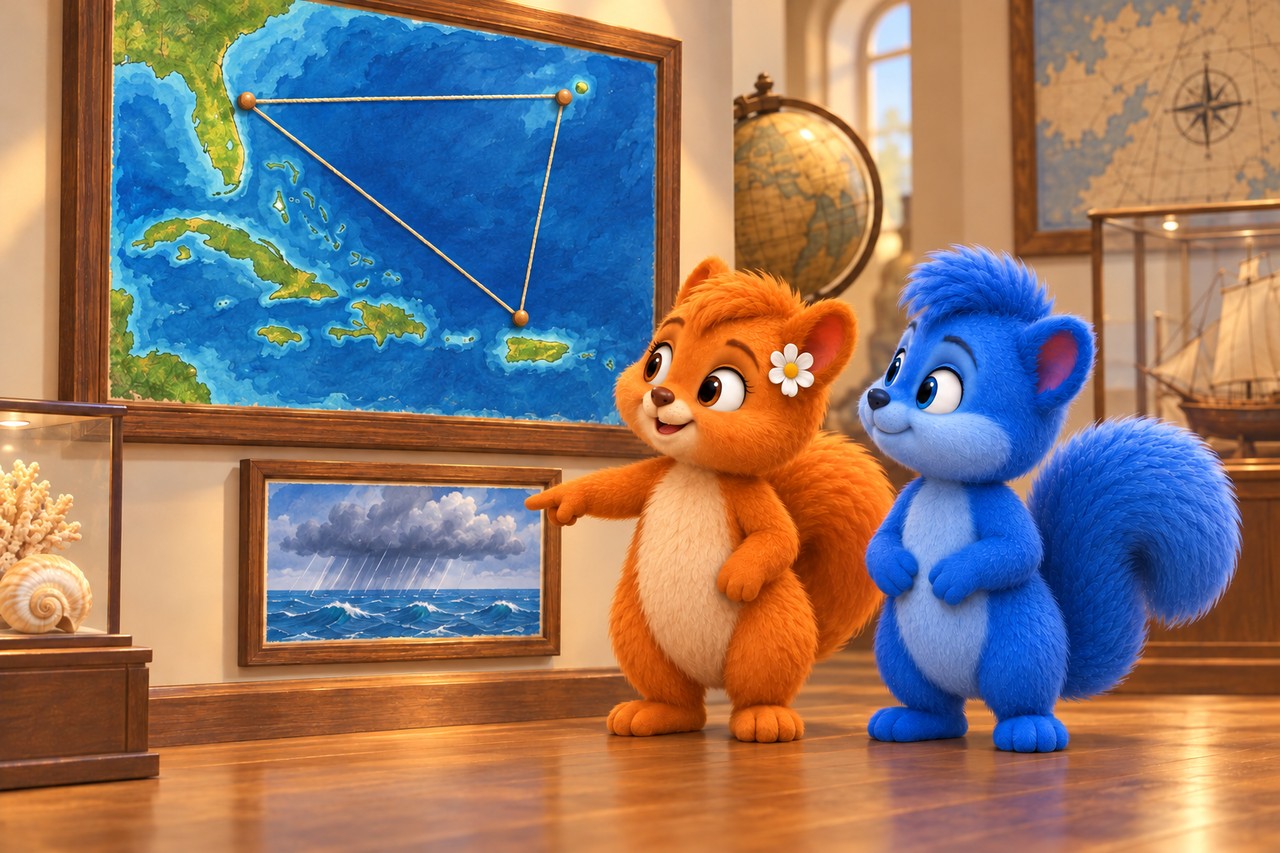
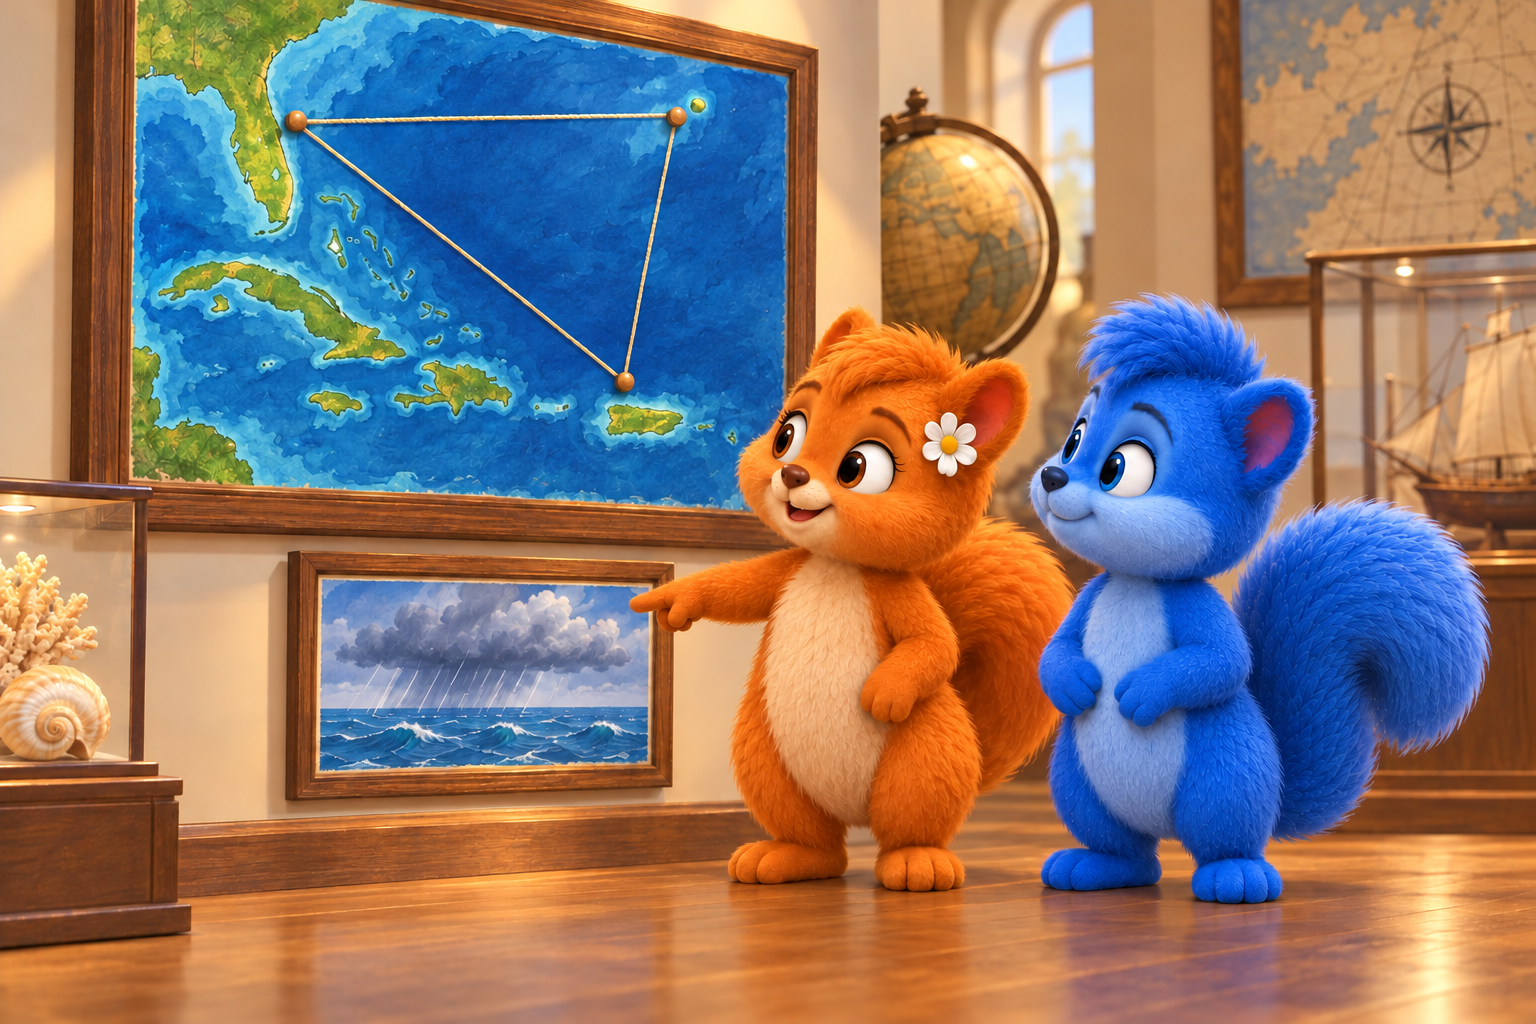
Equal-sized Wusels study a simplified Atlantic map and an ocean rain picture. Artistically simplified map, without exact coordinates, official boundaries or navigation guidance. The weather picture depicts no particular accident. AI-created illustration, not a photograph of nature.
What the diagram shows
The diagram simplifies the process. First compare its shapes and arrows. You can read its labels in larger text below.
Read the picture labels
These are the words and sentences from the diagram above. The full explanation follows below.
- A count needs a comparison size
- 100 trips
- 10 trips
- One event: 1 out of 100
- One event: 1 out of 10
- Invented number exercise, not accident statistics; red marks one event.
An imagined Wusel scene
Puschel and Flauschi investigate
Puschel counts three ship losses on a story map and thinks that is many. Flauschi asks how many ships travelled there. They seek dates, weather and comparison areas. Without those numbers, they leave a claim of exceptional danger undecided.
Look closely
The string shows the rough position of an often-discussed region. A weather picture hangs below. The painted map is neither a navigation chart nor an official boundary map.
An example to help you understand
Compare two invented ferry routes for a number puzzle. Route A makes 100 trips, route B ten. One trip on each does not go as planned. The same one event affects one in 100 trips on A, one in ten on B. Draw ten squares and ten groups of ten squares. These are invented numbers, not accident statistics; they illustrate why a count needs a comparison size.
Try explaining it
Why do we need comparisons when an area is called dangerous?
Choose a), b) or c), then explain your choice.
- a)More reports prove danger even without knowing how many journeys there were.
- b)The most exciting reports are enough to estimate frequency.
- c)Many stories alone do not show how frequent events are.
Show the explanation
Correct: c): Many stories alone do not show how frequent events are.
Many accident reports sound worrying. But places with many ships can have more reports too. We therefore compare accidents and numbers of journeys with other areas. We also check weather and reliable records.
An exciting story alone does not prove a mysterious force. Ten accidents among very many journeys mean something different from ten among very few. We therefore need both figures.
Explore in more detail
Here you will find longer explanations and further details. You can explore them together.
1. A name used in stories
The Bermuda Triangle is a loosely described area in the western North Atlantic. It is often drawn between Florida, Bermuda and Puerto Rico. Its boundaries are not officially fixed. Drawing a line gives the sea no new property; it initially locates a story.
Checked against: [1]
2. Hazards have checkable causes
Bad weather, shallow water and navigation mistakes can be dangerous at sea. Navigation means determining position and route. NOAA, a US weather and ocean agency, describes such ordinary hazards in this area too, rather than supernatural forces. Numerous Caribbean islands and shallow areas make route planning demanding. Tropical storms and hurricanes can cross the region, and the Gulf Stream is part of its environment. These are specific conditions researchers can investigate; an unexplained individual report does not establish a mysterious force.
Checked against: [1]
3. How often compared with what?
A long accident list alone is insufficient. Consider traffic levels and the period being studied. NOAA reports no evidence that mysterious disappearances happen more often there than in other large, busy ocean regions. This does not mean every individual historical report is completely explained.
Checked against: [1]
4. Check a claim
Ask who reports a story, and whether it has a date, place and checkable records. Missing information leaves uncertainty. Unknown does not automatically mean magical. An exciting book may contain invented events; a factual report needs appropriate evidence.
Checked against: [1]
An optional question for further exploration
You can use the longer explanation above. This is extra, not needed for the first quiz.
An extra question
Do many reported events alone prove that an area is particularly dangerous?
Discover the answer
No. Meaningful comparison also needs traffic levels, a time period and reliable information. A story alone proves no mysterious cause.
Pictures and sources for adults
Sources for further reading
Facts checked against the specialist sources below on 12 October 2026. The Wusel scene is fictional; comparisons and simplified models are explicitly explained. Sources are in English.